Treescore
Score a Christmas Tree based on uniformity of lights, shape of tree, and colors used.
Computer Vision to Delight and Amuse
Obsessing over the distribution of your Christmas Twinkle Lights? Wondering if your tree is standing straight, or maybe leaning just a little bit towards the wall? Too many red ribbons? Not enough glitter? Too many ornaments over here and a big gap over there?
Let us use computer vision to try and answer come of these questions.
Light Uniformity Score
To determine the uniformity of the lights on the tree, I first locate all the lights by identifying the brightest regions of the image (the lights). Then, for each light, I take the average distance between that light and its three closest neighbors. Finally, I take the standard deviation of all these averages. In addition, I want to reward trees that have more lights (while still maintaining uniformity), so the score is scaled up by the number of lights.
The score returned is calculated as
light_score = 100 - log(num_lights) * sqrt(std_dev(avg_light_dist))Tree Shape Score
The shape of the tree is compared to a triangle with the ratio of 4/1. Where did that come from? I measured a picture of a tree that I found to be visually appealing... Yes, completely subjective. In addition to judging the height/width ratio, I compare the observed angle of the tree (from the middle point between the bottom left and bottom right corners to the top) with a vertical line and calculate the angle in degrees.
The score returned is calculated as
shape_score = 100 - abs(ideal_ratio - observed_ratio) * angleColor Score
The ideal Christmas colors are green, red, gold, and white. I somewhat arbitrarily decided that a pleasant distribution of colors was 50% green, 20% red, 20% gold, and 10% white. So that is what I am scoring on.
The score returned is calculated as
color_score = 100 - sum(abs(ideal_ratio[c] - observed_ratio[c])
                        for c in ['green', 'red', 'gold', white'])
Combined Score
Finally the scores are combined
total_score = sum(light_score, shape_score, color_score) / 3
An Example
Start out with an image of a lovely tree.

To locate the lights, a threshold is applied to find the brightest regions in the image.
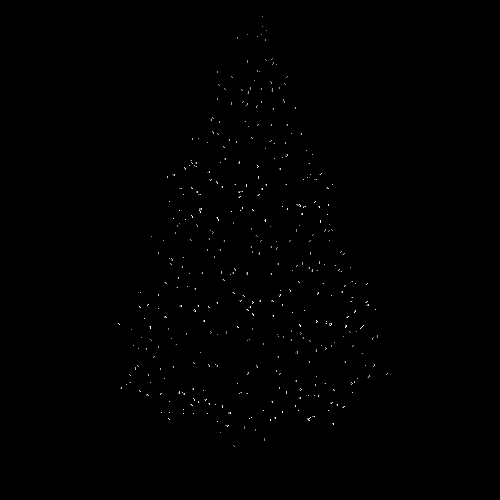
The center of each bright region is found and the (x, y) coordinates determined. At this point it is simply a matter of treating the lights as points in a plane to determine the distance.

light_score: 84.74
To determine the shape of the tree, a color filter is applied which attempts to detect all green pixels in the image and blank out everything else. This modified images is then transformed into a binary mask.

Once the mask has been determined, a contour is found on the binary image. This contour should correspond to the outline of the tree.

At this point, I assume the tree is the main focus of the image. Thus the bottom right corner of the tree is the point on the contour closest to the bottom right corner of the image. Similar logic for the bottom left corner. The top of the tree is the midpoint (average x) of the highest points (lowest y) on the contour.
With the corners determined, an outline of the tree can be drawn, as well as the observed line from center bottom to the top.
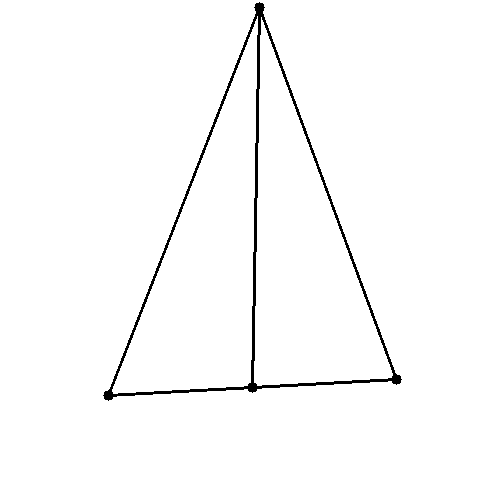
shape_score: 97.24
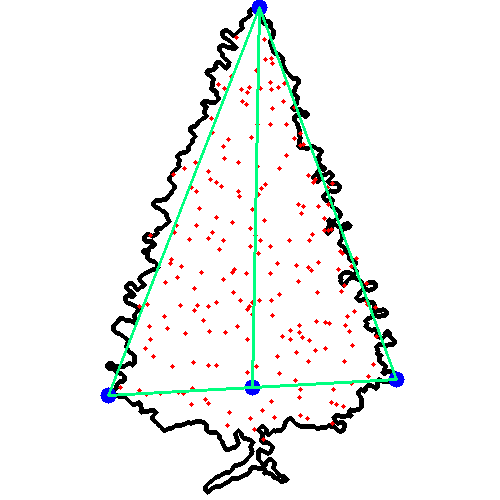
Putting it all together, this is how the tree shape and lights turned out.
For the color component lets use another tree, since the tree above is not decorated. In this case, a lovely tree in a living room.
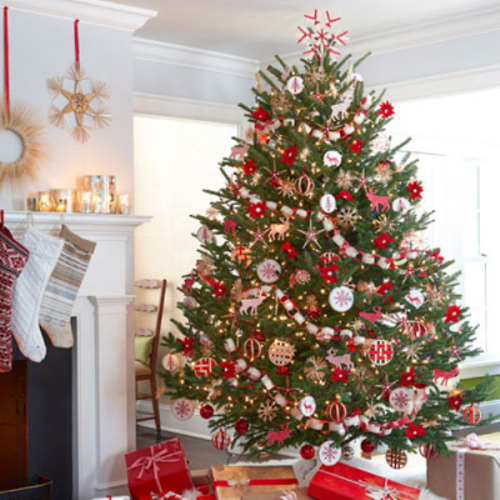
Once again, an attempt is made to cut out the tree itself. This time the mask is a bit less precise since there it a fair amount of noise in the image.
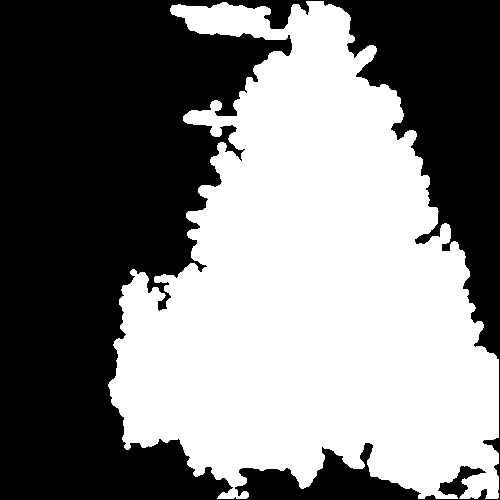
The mask is then used to remove everything except for the tree, and the remaining image is categorized into green, red, gold, and white.
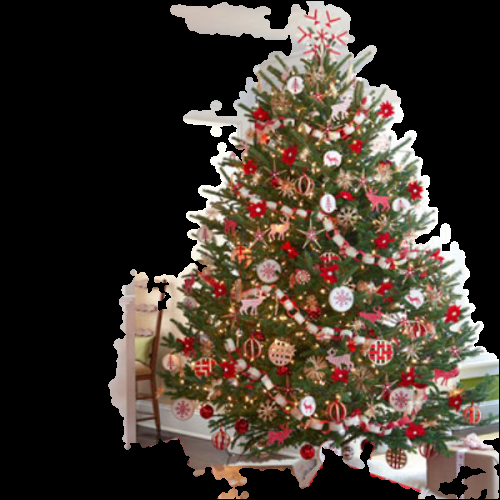
Finally the observed color ratios are compared with the ideal ratio. In this case, the tree is spot on with regards to green, but is lacking red and has too much white.
color_score: 70 (green:50.0% white:25.0% gold:16.7% red:8.3%)In The Wild
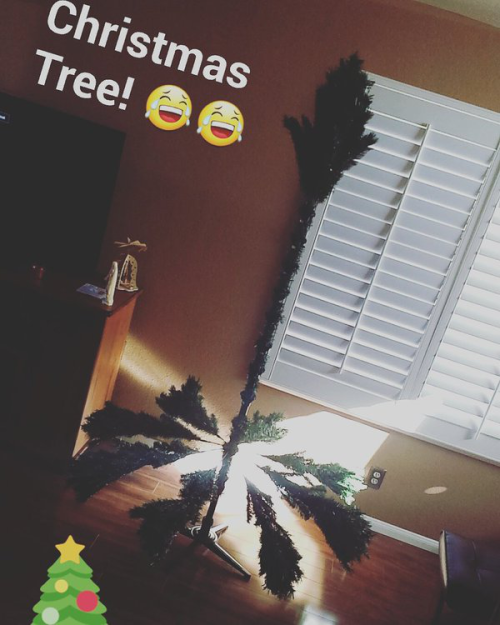
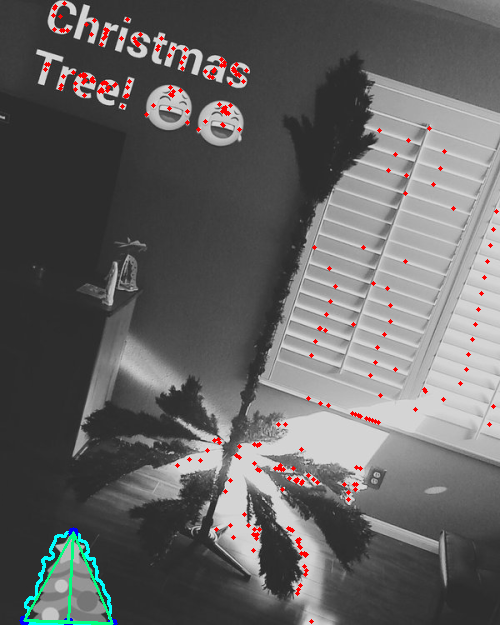
In the wild, there are some spectacular failures such as the following image.


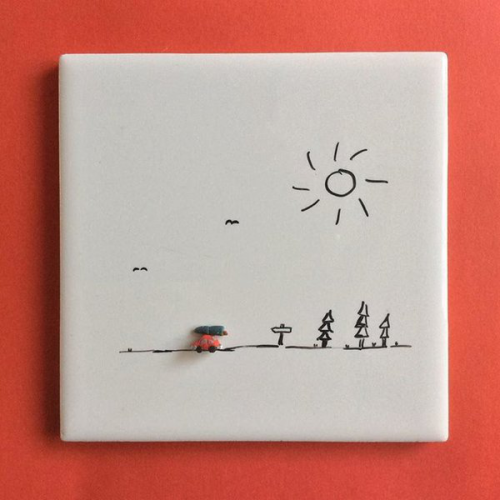
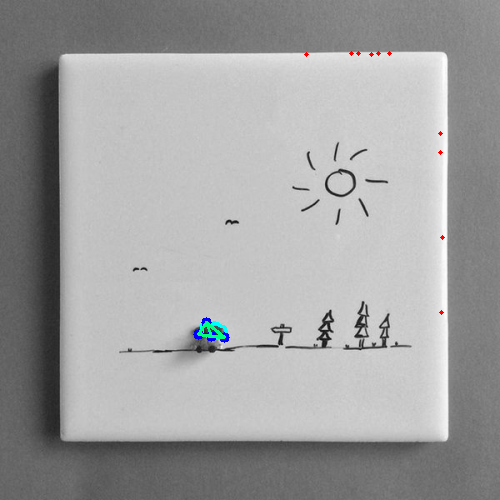
Other times, it is surprisingly clever at picking out the tree, such
as the tiny little one on the car roof here.
